In MLB history there have been 290 no-hitters. A No hitter could be the most well known single game accomplishment a baseball player can make possibly because at about twice per season (on average) it is rare enough that it is big news when it happens but it is not so rare that people haven’t heard of it. This year Chris Heston, Max Scherzer, and Cole Hamels have all pitched no-hitters. Here I will explore the odds surrounding this feat in four questions. I left most of my calculations out but they can be seen at the bottom.
1. If I went to any given MLB game today what is the chance of a no hitter by one of the two sides?
It is 0.076% or about 1/1,300 (calculations can be seen at the bottom) this means that the odds that we would have three no-hitters by this point in the season is 3.1%
2. What is the average number of no-hitters in a modern baseball season?
This means in a whole season in which there are 2,430 games (plus 22-44 games for the postseason) there would be an average about 2 no-hitters per year.
3. What game would have the highest chance of a no-hitter in 2015?
Zack Greinke has the best batting average against him of all pitchers this year (.186) and the Mets lineup has the worst AVG we can then calculate that their lineup against Greinke would have an AVG of .173 this means the odds are 1/170 or 0.59% (just for Greinke not including the odds of the opposing pitcher) This is 15 times more likely than your typical game. Sadly the Dodgers won’t be playing the Mets again this season, but they will be playing the padres multiple times and they give Greinke a 1/175 chance of a no-hitter.
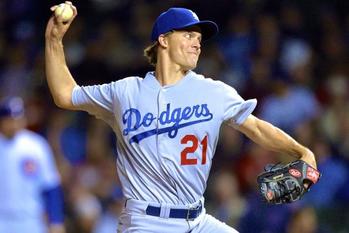
Zack Greinke has a 0.39% chance of a no-hitter per start, and against the Mets it is a 0.59%.
 4. What where the odds for Chris Heston, Max Scherzer, and Cole Hamels’s no-hitters? All of these no hitters occurred in situations where the odds where higher than the average game. However they were all still very unlikely events. a. Heston: 0.11% or 1/878 Heston only had a 1/1594 in his typical games this year but this one was against the Mets who have had the worst AVG in the majors this season so his odds nearly doubled. There was a 1.2% chance that he would have a no-hitter at some point this season by now. | 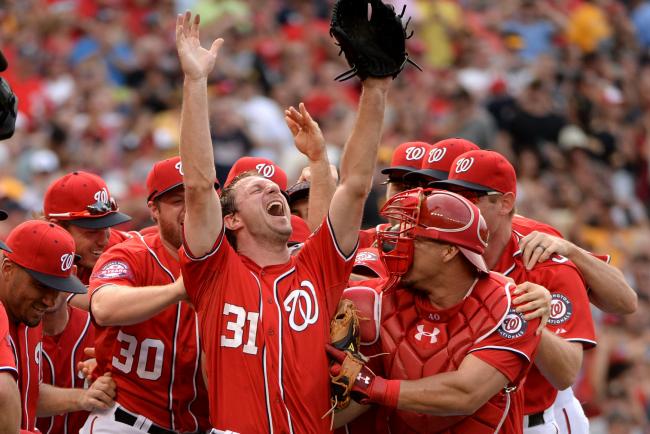 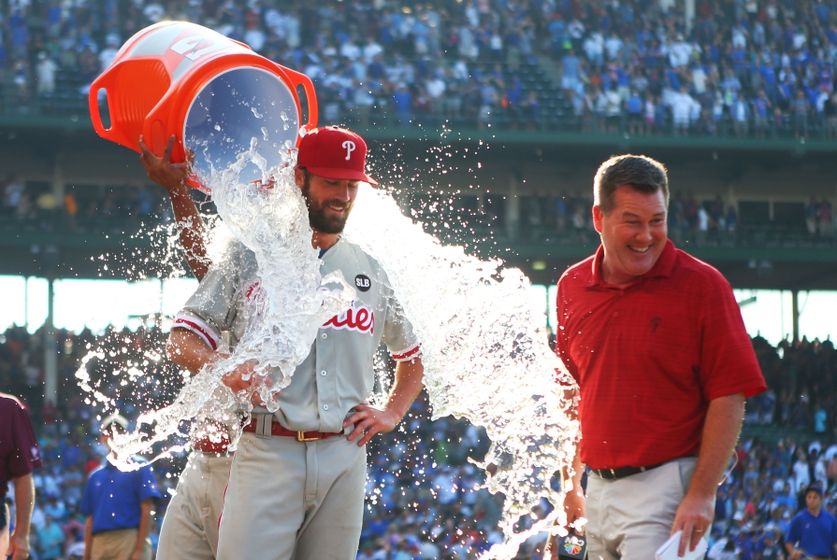 |
b. Scherzer: 0.28% or 1/361 This year Scherzer has had the second best odds for a no-hitter (behind Greinke) the odds that he would have a no-hitter by now this year are 6.2%. This is clearly a pretty good chance considering the odds for the average starter.
c. Hamels: 0.13% or 1/797 approximately half the chance of a no-hitter in Scherzer’s game, but Hamels still had okay odds in this game better than Heston had. The odds that Hamels would have a no-no by now this year are 1.5%.
c. Hamels: 0.13% or 1/797 approximately half the chance of a no-hitter in Scherzer’s game, but Hamels still had okay odds in this game better than Heston had. The odds that Hamels would have a no-no by now this year are 1.5%.
Calculations:
1. (Average chance of not getting a hit in an at bat)^(outs in a game)x(Teams)
(1 – average MLB AVG)^(outs in a game)x2
((1 - 0.253)27)x2= 0.00076 or 0.076% or 1/1,300
2. (Games in a season)x(chance of a no-hitter)
2,463x0.00076 = 2
3. (1-(Mets AVG/MLB AVG)x(Greinke AVG))^(outs in a game)
(1-(.235/.253)x(.186))27 =0.0059 or 1/170
4. Three parts
a. (1-(Mets AVG/MLB AVG)x(Heston AVG))^(outs in a game)
(1-(.235/.253)x(.239))27 =0.11% or 1/878
b. (1-(Pirates AVG/MLB AVG)x(Scherzer AVG))^(outs in a game)
(1-(.257/.253)x(.193))27 =0.28% or 1/361
c. (1-(Cubs AVG/MLB AVG)x(Greinke AVG))^(outs in a game)
(1-(.238/.253)x(.233))27 =0.13% or 1/797
 RSS Feed
